
Consulting, convening, coding, covering new ground, plus occasional commentary.
consulting
Anatomy of $100,000
How 1,000+ individuals helped to take The Tyee national
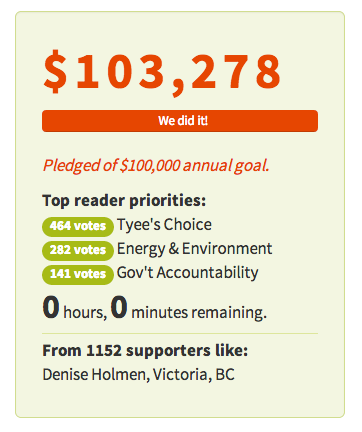
On the eve of November 18th, the last night of The Tyee’s time-limited crowd-funding campaign to go national, I peeled myself away from my keyboard as the fundraising widget ticked past $85,000. Knowing that I would be up all night otherwise, I forced myself hit the hay at 11:30PM Central, just as the ticker was soaring past $87,000. When I woke in the morning and checked the final tally, the campaign had surpassed its $100,000 goal; the morning before, the campaign had raised just $75,000, making the campaign’s success of hitting its target appear just out of reach.
So what happened? In the final 24 hours, the campaign gained a new momentum driven by urgency that encouraged more than 400 individuals to sign up and commit more than $25,000. That means that more than one third of the total number of campaign contributors signed-up during the last day of the campaign and contributed more than one quarter of the total campaign goal. I have experienced similar “hockey stick” spikes in the final hours of an online fundraising campaign, but very few as profound as this one. Needless to say, everyone at The Tyee was blown away by the support that was shown during the three-week campaign.
I was curious to understand a bit more about who was contributing, how they were contributing, and where the contributions were coming from, so I did some quick digging to share some rough analytics:
- More than 1,100 contributions came in through the campaign site in less than four weeks (24 days to be precise)
- More than 500 contributors asked to receive one of The Tyee’s e-mail newsletters
- The average time spent on the the campaign site was 3:10 with the majority spending 2:33 (curiously, those coming from “google/organic” spent a whopping 7+ minutes; Facebook and Twitter visitors also tended on average to spend more than 4 minutes.) No doubt the campaign video, at 2:41, had a lot to do with this.
The top five Canadian provinces by number of contributions to the campaign are:
- British Columbia
- Ontario
- Alberta
- Manitoba
- Quebec
Interestingly, there were also six contributions from Oaxaca, Mexico (where I am currently located), so a big thanks to my friends down here for supporting independent journalism! There was also one contribution from Osaka Prefecture in Japan – is that you, Paul?
In terms of where the contributions originated, here’s a very rough estimate:
- Roughly 800 contributions appear to have come directly from e-mail campaigns initiated by The Tyee to its various e-mail lists, or via direct e-mails from supporting organizations to their e-mail lists. Once again, e-mail proves to be a very strong medium for engaging people to act (a drum that I’ve been beating for years now, much to the chagrin of the social media folks).
- Roughly 200 contributions are filed under “direct” in Google Analytics, which could likely be direct sharing via e-mail by other contributors (as we ask them to do as the final step of their contribution).
- Roughly 150 contributions attributed to “google/organic,” which seems odd to me. Curious what other people would attribute these to?
- Slightly more than 100 contributions attributed to Twitter (t.co and so on)
- Slightly less than 100 attributed to Facebook (including m.facebook.com and so on)
- Roughly 25 attributed to links on The Tyee’s Web site (house ads, links from feature stories and so on)
- Roughly 15 attributed to “Buffer,” which would most likely be me, personally, because I use Buffer App almost exclusively to post to social media, and I did a lot of that during the campaign.
- Roughly 10 attributed to Vimeo, which is where the campaign video lives
- Roughly 10 from The Tyee’s mobile site and app
- And even 4 people visiting via HuffingtonPost.ca became contributors (thanks HuffPo!)
Most interestingly for me was the fact that more than 120 of the contributions were completed on mobile devices (iPhone, iPad, and Android phones and tablets). Even though that’s only 10% of the total number of contributions, that’s still one in ten people who are deciding to pull out their credit card and make a contribution on their phone or tablet. As as speculated earlier, developing the campaign site to work flawlessly on small screens (no small amount of work!) was probably helpful in this regard.
Here’s the rest of the browser and operating system breakdown for contributors to the campaign:
- Firefox 31%
- Safari 29%
- Chrome 26%
- Internet Explorer 14%
I was surprised to see IE so low on the list, as it’s often a relatively high percentage of visitors to The Tyee in general).
Here’s how operating systems fared:
- Windows 45%
- Mac 42%
- iOS 9%
- Linux / Android 3%
- Blackberry 1%
- Chrome OS 0.5%
There you have it: the anatomy of $100,000 committed to support more fact-driven independent reporting in Canada by The Tyee. If I can find a bit of time this week, I may try to cook up a time series visual that shows that spike of contributions in the final hours of the campaign; my heart starts racing just thinking about that night again!
A few folks have fired me questions about the campaign that I’ve tried to answer in this post, and this one. Feel free to leave questions here, or drop me a note on Twitter, and I’ll try to answer them as I have time.
If you contributed to the campaign, thank you! If you didn’t and would like to, it’s not too late! ;)
About
Hi, I'm Phillip Smith, a veteran digital publishing consultant, online advocacy specialist, and strategic convener. If you enjoyed reading this, find me on Twitter and I'll keep you updated.
Related
Want to launch a local news business? Apply now for the journalism entrepreneurship boot camp
I’m excited to announce that applications are now open again for the journalism entrepreneurship boot camp. And I’m even more excited to ...… Continue reading
Previously
Getting to 1.1.0
From the future
Four predictions for 2014